> For the complete documentation index, see [llms.txt](https://docs.ox.security/llms.txt). Markdown versions of documentation pages are available by appending `.md` to page URLs; this page is available as [Markdown](https://docs.ox.security/vibesec/vibesec-dashboard.md).
# VibeSec Dashboard
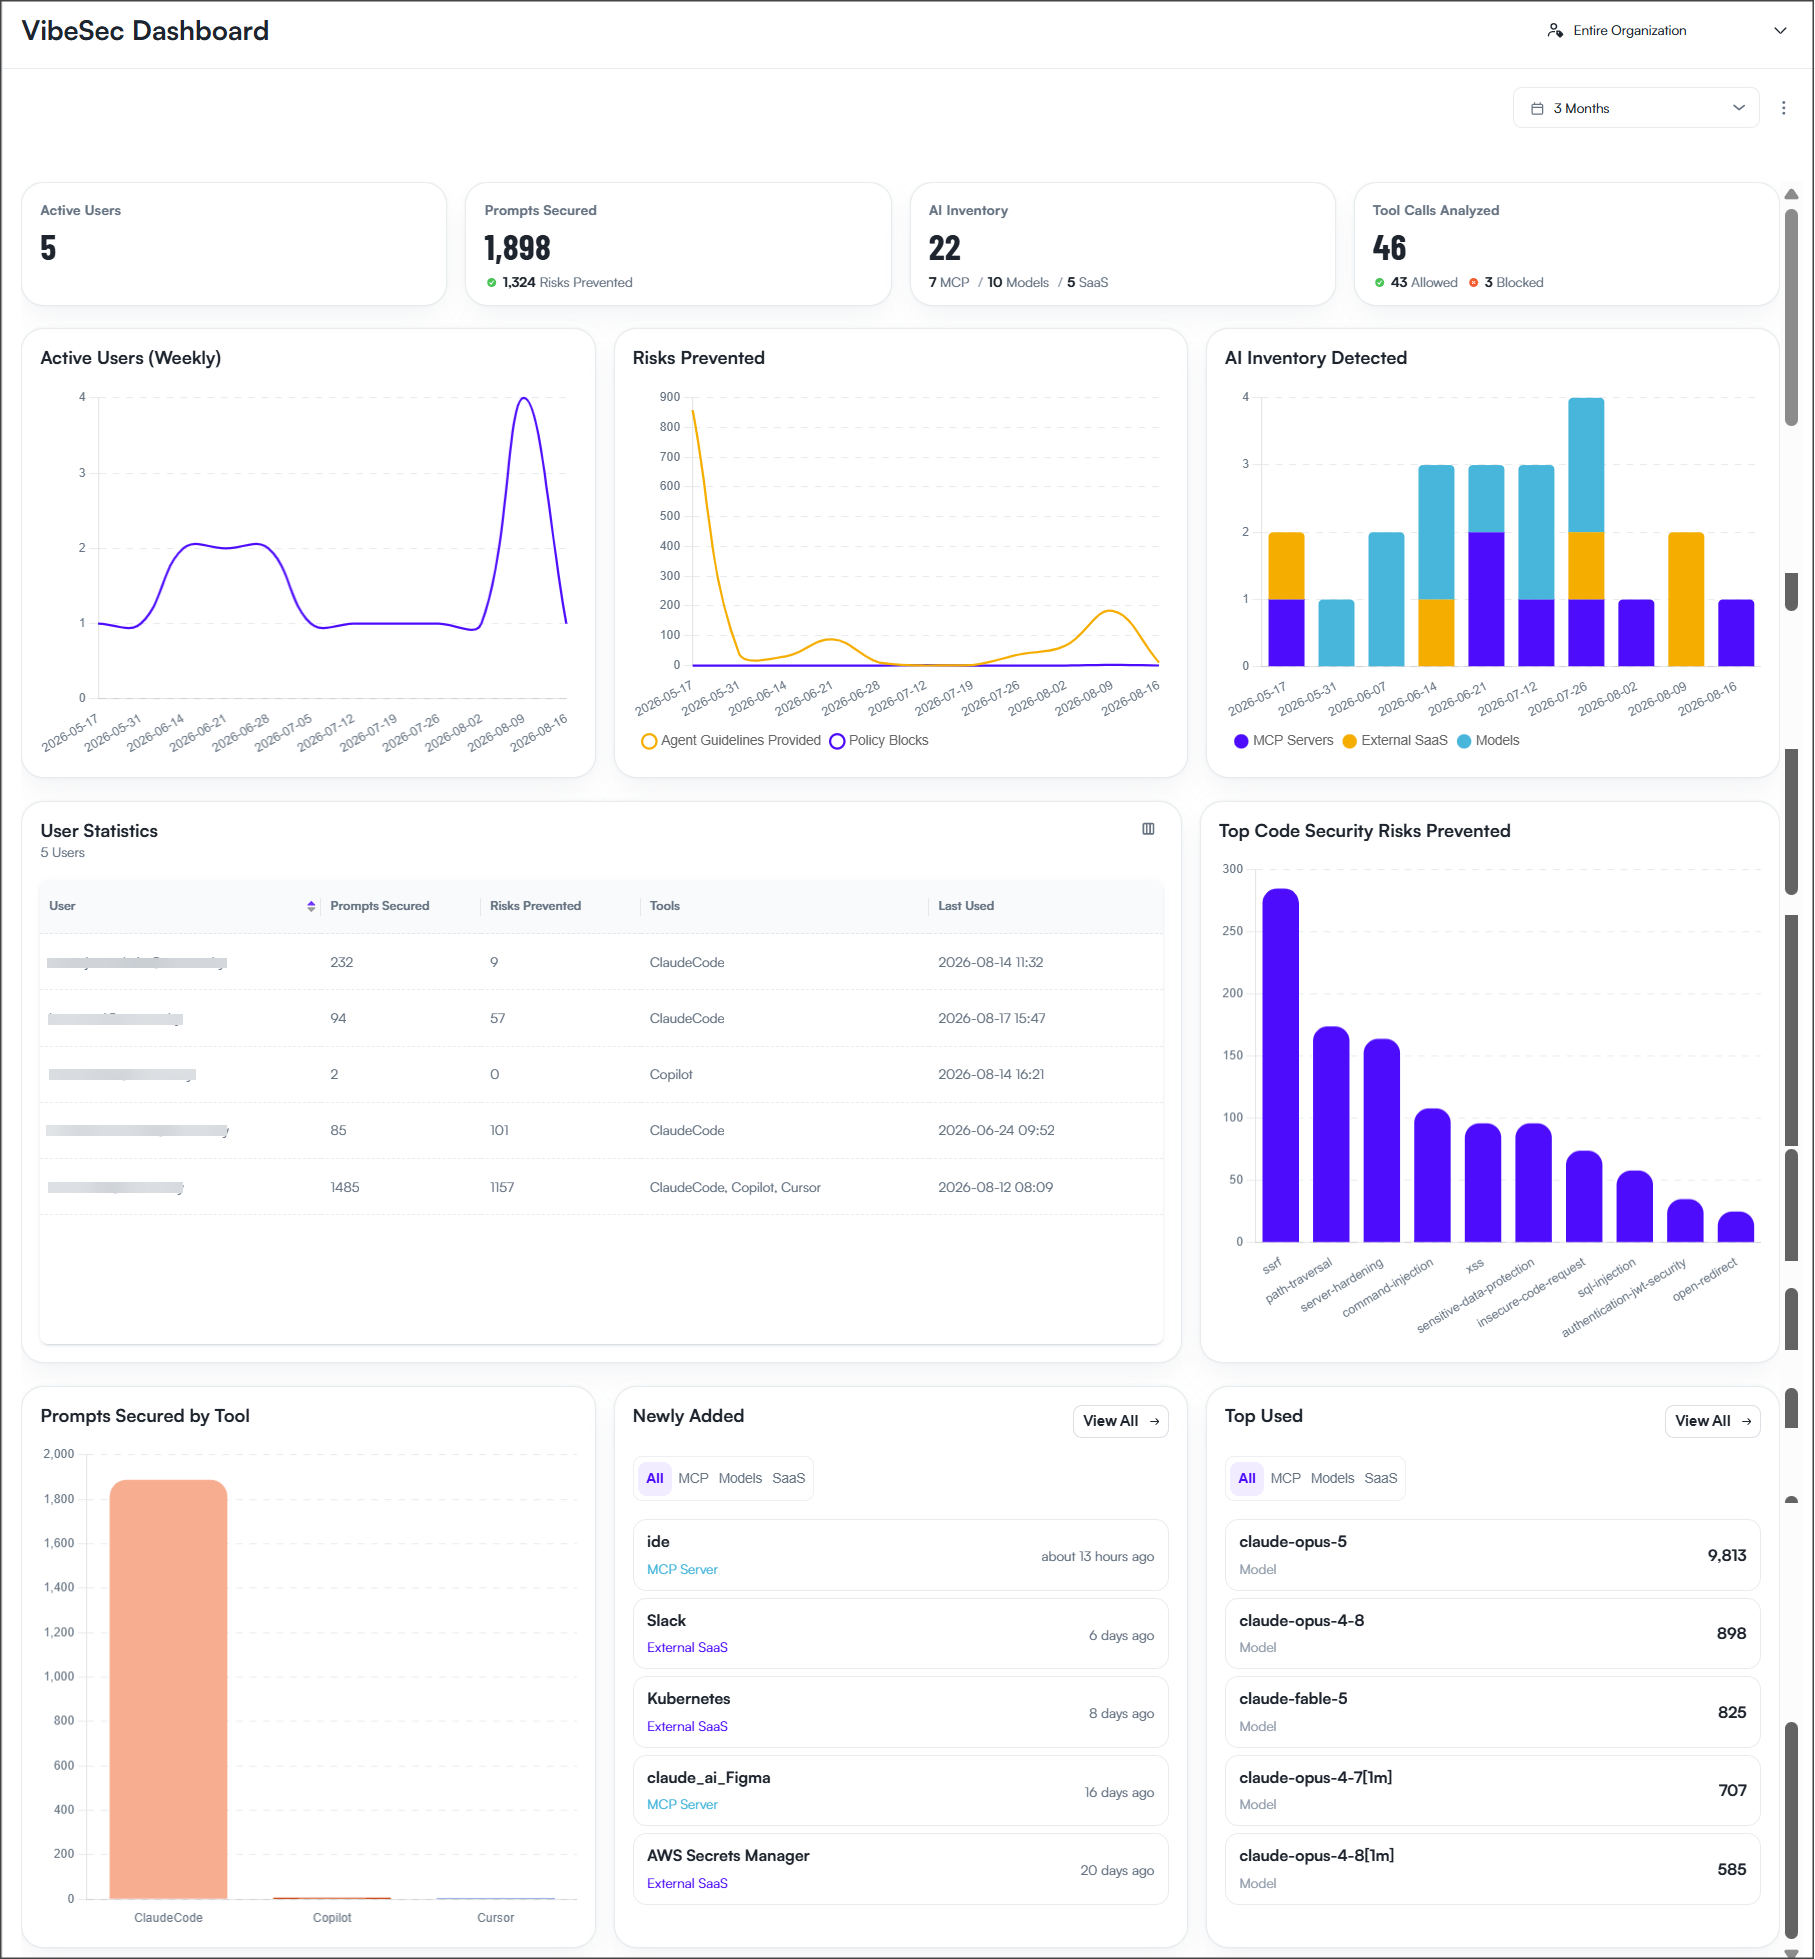
The VibeSec Dashboard provides an organization-wide view of VibeSec usage, AI inventory, and security activity.
You can track developer engagement, review AI components and tools in use, and see how VibeSec helps prevent security risks during AI-assisted development.
Use the date range selector to control the period displayed on the dashboard. The selected date range applies to the dashboard metrics and charts.
The dashboard includes:
* [Key metrics](#key-metrics)
* [Activity trends](#activity-trends)
* [User Statistics](#user-statistics)
* [Top Code Security Risks Prevented](#top-code-security-risks-prevented)
* [Prompts Secured by Tool](#prompts-secured-by-tool)
* [Newly Added](#newly-added)
* [Top Used](#top-10-risks-prevented-by-vulnerability)
## Key metrics
The tiles at the top of the dashboard summarize VibeSec activity for the selected date range.
| Metric | Description |
| ----------------------- | ----------------------------------------------------------------------------------------------------------------------------------------------------------------------------------------- |
| **Active Users** | Number of developers who actively used VibeSec during the selected date range. A user is counted as active when their AI agent communicates with the OX backend while VibeSec is enabled. |
| **Prompts Secured** | Number of prompts analyzed and secured by VibeSec during code generation. The tile also shows the number of risks prevented. |
| **AI Inventory** | Number of AI components detected in your environment. The breakdown shows the number of MCP servers, AI models, and external SaaS tools detected. |
| **Tool Calls Analyzed** | Number of AI tool calls analyzed by VibeSec. The breakdown shows how many tool calls were allowed and blocked. |
## Activity trends
The activity charts show how VibeSec usage, security activity, and AI inventory changed during the selected date range.
| Chart | Description |
| ------------------------- | -------------------------------------------------------------------------------------------------------------------------- |
| **Active Users (Weekly)** | Number of active VibeSec users per week. |
| **Risks Prevented** | Number of security risks prevented over time. The chart distinguishes between Agent Guidelines Provided and Policy Blocks. |
| **AI Inventory Detected** | Number of AI components detected over time, grouped by MCP servers, external SaaS tools, and AI models. |
## User Statistics
The User Statistics table shows VibeSec activity for each developer. You can use it to identify active users, compare VibeSec usage, and see which AI coding tools each developer uses.
| Column | Description |
| ------------------- | ------------------------------------------------------------------------------- |
| **User** | Developer's email or ID. |
| **Prompts Secured** | Number of prompts secured by VibeSec for the user. |
| **Risks Prevented** | Number of security risks prevented for the user. |
| **Tools** | AI coding tools used by the developer, such as Claude Code, Copilot, or Cursor. |
| **Last Used** | Most recent VibeSec interaction for the user. |
## Top Code Security Risks Prevented
The Top Code Security Risks Prevented chart shows the code security risks that VibeSec prevented most frequently during the selected date range.
The chart groups prevented risks by vulnerability type, such as XSS, path traversal, server-side request forgery (SSRF), command injection, and SQL injection.
Use this chart to identify the security risks that occur most frequently during AI-assisted development.
## Prompts Secured by Tool
The Prompts Secured by Tool chart shows the number of prompts secured by VibeSec for each AI coding tool.
Use this chart to compare VibeSec usage across tools such as Claude Code, Copilot, and Cursor.
## Newly Added
The Newly Added widget shows AI inventory components that were recently detected in your environment.
You can filter the widget by:
* All
* MCP
* Models
* SaaS
Each entry shows the component name, its type, and when it was detected.
Select **View All** to open the AI inventory and review additional components.
## Top Used
The Top Used widget shows the AI inventory components used most frequently in your environment.
You can filter the widget by:
* All
* MCP
* Models
* SaaS
Each entry shows the component name, its type, and usage count.
Select **View All** to open the AI inventory and review additional usage information.
---
# Agent Instructions
This documentation is published with GitBook. GitBook is the documentation platform designed so that both humans and AI agents can read, navigate, and reason over technical content effectively. Learn more at gitbook.com.
## Querying This Documentation
If you need additional information that is not directly available in this page, you can query the documentation dynamically by asking a question.
Perform an HTTP GET request on the current page URL with the `ask` query parameter, and the optional `goal` query parameter:
```
GET https://docs.ox.security/vibesec/vibesec-dashboard.md?ask=&goal=
```
`ask` is the immediate question: it should be specific, self-contained, and written in natural language.
`goal` is optional and describes the broader end goal you are ultimately trying to accomplish on behalf of the user. GitBook uses it to tailor the answer towards what is most useful for that goal.
The response will contain a direct answer to the question and relevant excerpts and sources from the documentation.
Use this mechanism when the answer is not explicitly present in the current page, you need clarification or additional context, or you want to retrieve related documentation sections.